Look beyond the watts
Two pedal strokes can produce the same power without looking much alike.
Pedaling Dynamics lets you see how you are applying that power.
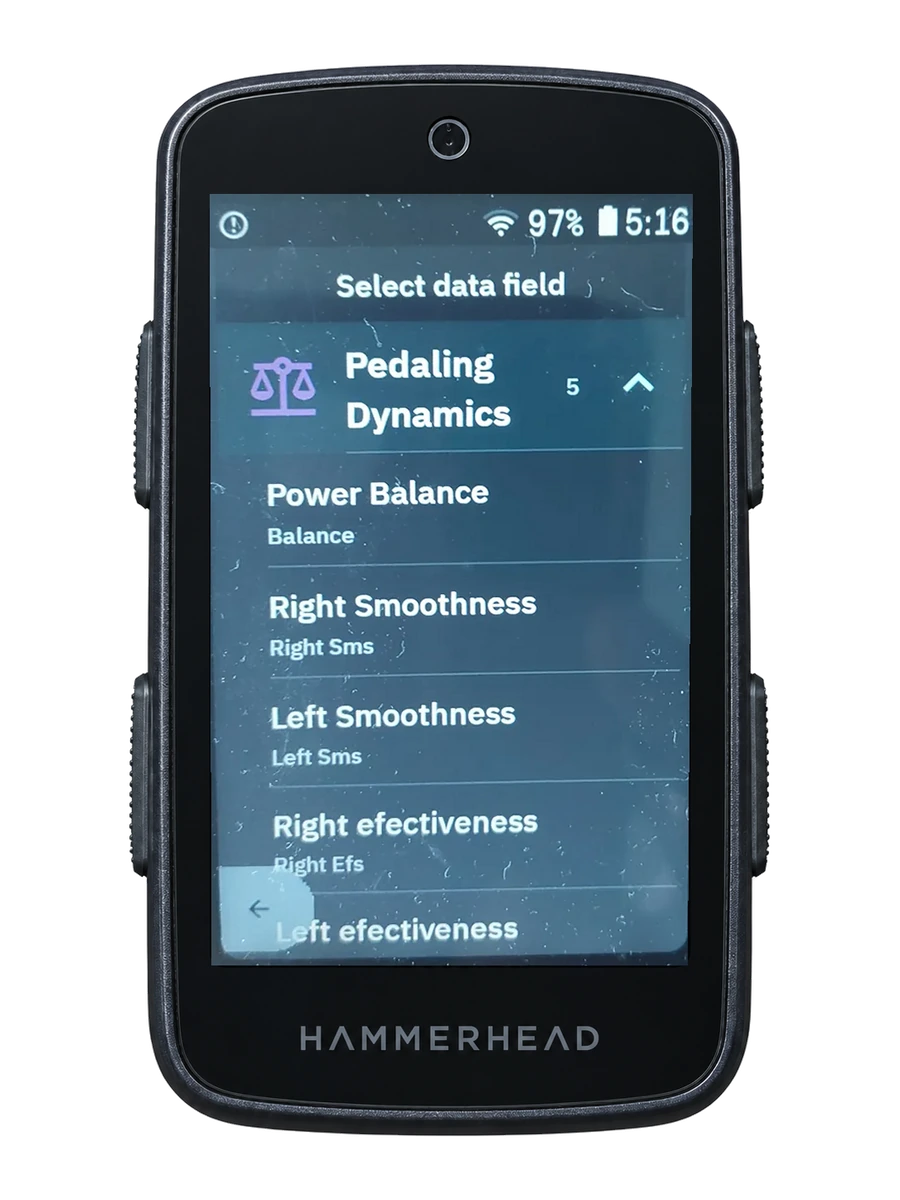
The view brings together three main metrics: left/right balance, Torque Effectiveness and Pedal Smoothness.
Left/right balance
This shows how the contribution is split between both legs.
A split close to 50/50 is not a universal target, but changes during a ride may help you understand fatigue, technique or differences between efforts.
Torque Effectiveness
This describes how much of the torque applied to the pedal contributes to useful forward motion.
It offers another way to look at how force is applied through the pedal stroke.
Pedal Smoothness
This describes how evenly power is applied through the pedalling cycle.
Together with the other metrics, it provides a broader picture than balance alone.
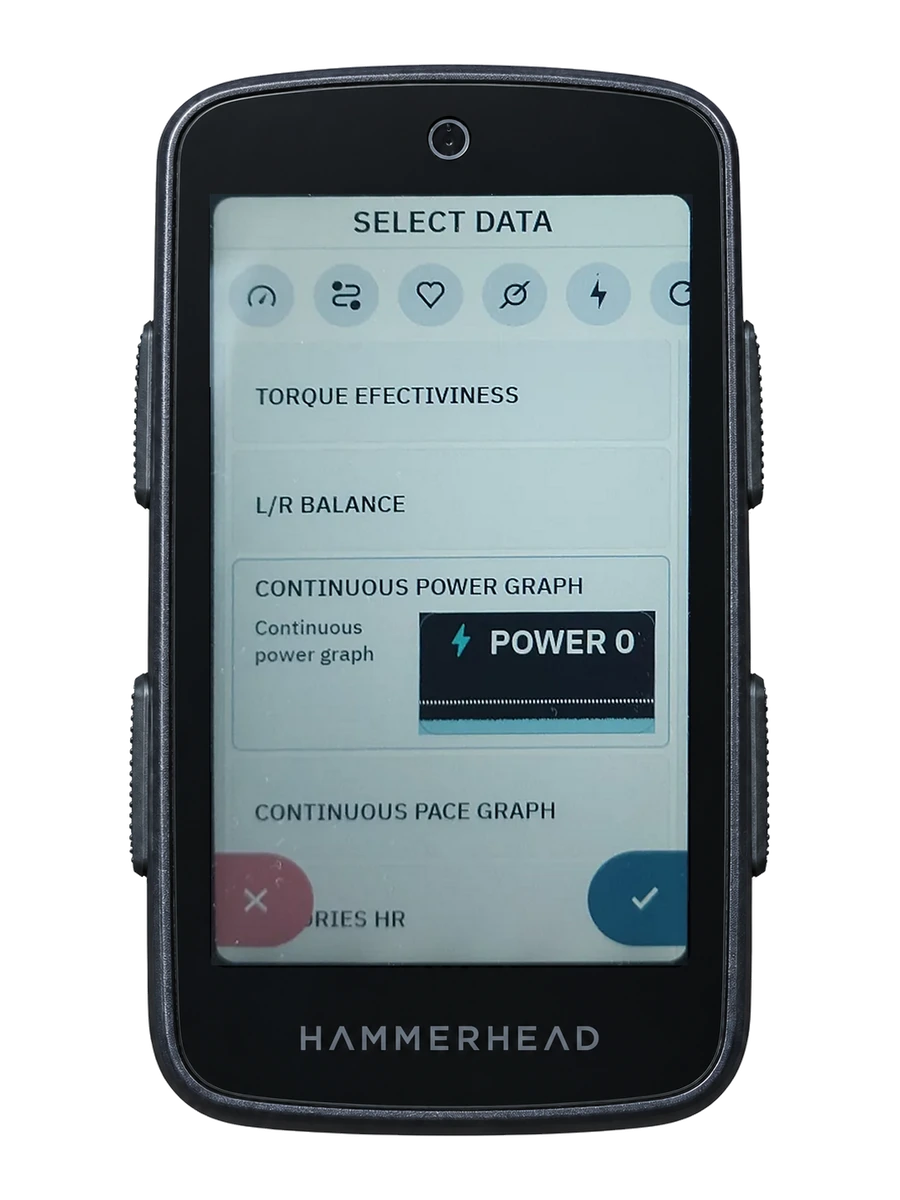
A chart that follows the change
Select any of the metrics and follow its evolution over the previous 90 seconds.
That turns a single snapshot into a trend.
You do not only see how you are pedalling. You see how it is changing.